Independent Academic English guide · Updated 22 October 2026
IELTS Academic Writing Task 1: Describe Charts, Maps and Processes (2026)
Use this independent pre-draft guide to read a Task 1 visual, select its main features, plan an overview, and organise accurate support. It is not an official IELTS product, a band calculator, a model-answer library, or a score guarantee.
Quick answer
For IELTS Academic Writing Task 1, read what the visual shows, identify its major trends, changes, comparisons, or stages, then choose supporting details that make that overview accurate. IELTS.org currently lists statistical visuals such as graphs, charts, and tables, as well as process diagrams, maps, and plans. It says a writer should select and report main features and make comparisons where relevant. This guide supports planning your own factual description; it cannot mark, predict, calculate, or guarantee an IELTS result.
Read the visual before vocabulary
Before drafting, identify the visual type, title, labels, units, categories, locations, time frame, and exact task instruction. Current IELTS format guidance describes Task 1 as a description of visual information in the writer’s own words, with a minimum of 150 words in about 20 minutes. It can involve presenting or comparing data, describing stages or sequences, or explaining how something works. IELTS Academic Writing format
- Read the task frame: distinguish a change over time from a one-time comparison, a spatial change, or a process.
- Find the visual logic: ask whether it communicates movement, category difference, proportions, location change, or sequence.
- Respect evidence limits: report only information in the visual; do not add causes, opinions, or missing context.
The University of North Carolina Writing Center explains generally that figures can reveal trends, patterns, relationships, and processes when their information is communicated clearly. UNC Writing Center — Figures and Charts The IELTS pages, however, govern the test’s current requirements.
Separate main features from supporting detail
Not every item in a visual needs to appear in a short description. IELTS preparation guidance distinguishes an overview of main patterns, trends, events, or changes from body details that support it. The task wording and visual decide what matters—not a fixed template.
Likely main features
- The largest rise, fall, fluctuation, or stable trend.
- A dominant comparison between groups, categories, or locations.
- The highest, lowest, earliest, latest, or most substantial change.
- The principal stages of a process or developments in a map or plan.
Useful support
- Figures that illustrate a selected trend or contrast.
- Relevant comparisons, rather than every possible comparison.
- Positions and directions that clarify a map or plan change.
- Steps, inputs, outputs, or ordering that explain a visual process.
IELTS.org says Task 1 key features may be trends, process steps, or major changes in maps and plans. Relevant figures, positions, and other information should illustrate the chosen features, and reporting should remain accurate. IELTS Writing preparation resources
Charts, maps, plans, and processes need different planning lenses
Charts, graphs, and tables
Look for movement, comparisons, ranking, range, or proportions. For a line graph, note major movement across a period; for a bar chart, identify the comparison that matters; for a table, decide which rows or columns create the clearest contrast. Verify units before choosing any figure.
Maps and plans
Mark what was added, removed, relocated, replaced, or unchanged. Group nearby or functionally related developments when this makes the visual easier to follow. Use location or direction language only when the supplied plan supports it.
Processes and diagrams
Trace the start, the significant transformations, sequence, and end point. Use order language to make the route clear, but do not add scientific causes or technical steps that the visual does not supply.
Unfamiliar visuals
Do not force an unfamiliar image into a memorised script. First identify its organising principle—time, category, place, stage, or relationship—then select and organise information around that principle.
Four fictional Task 1 visual examples
These are planning examples, not official IELTS questions, band models, real data, or text to submit. They teach visual reading, key-feature selection, overview planning, and accurate support grouping—not a response to copy.
Downloadable practice visuals: fictional line chart (SVG) · fictional park plans (SVG) · fictional process diagram (SVG) · fictional mixed visual (SVG). These original visuals may be downloaded for individual or classroom planning practice; retain their fictional and independent-not-official-IELTS labels.
Fictional chart, graph, or table example
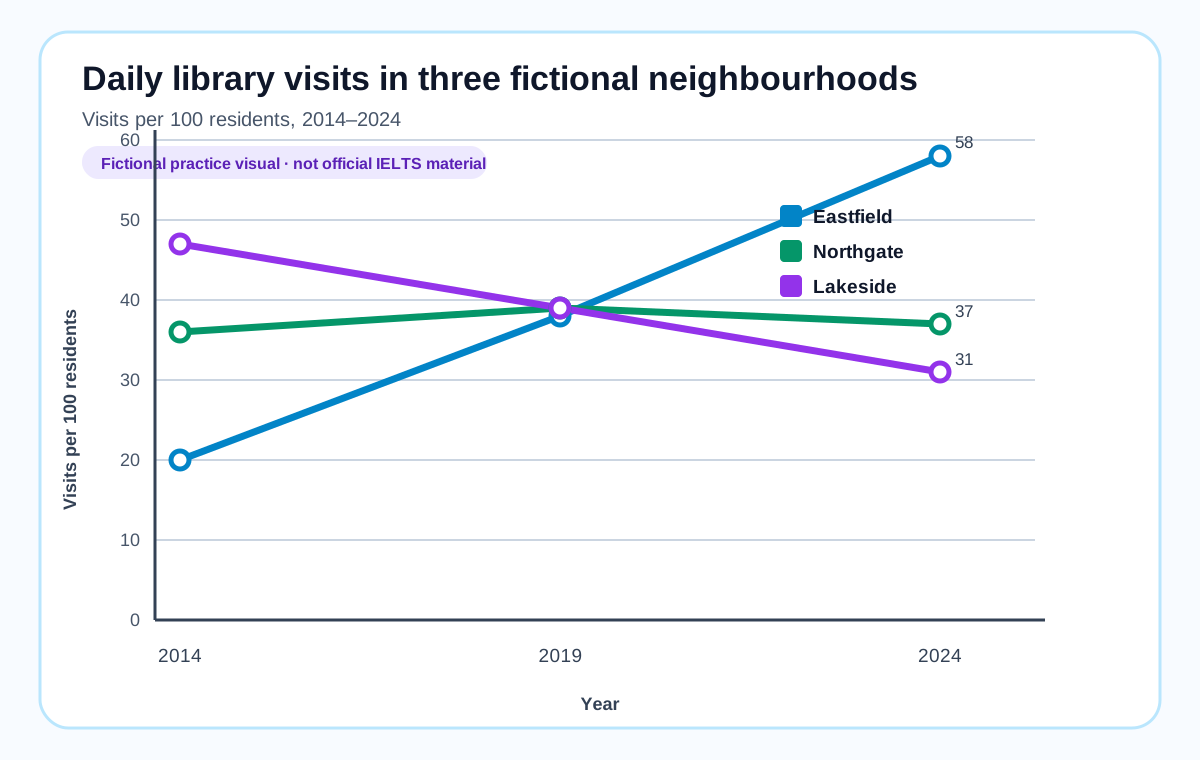
A line graph records library visits in three fictional neighbourhoods from 2014 to 2024: Eastfield rises from 20 to 58 visits per hundred residents, Northgate stays between 36 and 39, and Lakeside falls from 47 to 31. Plan around change over time: an overview can identify the strong rise, the decline, and the stable series; supporting detail can use the start and end points plus Northgate’s narrow range. Do not infer reasons for the change, because the visual provides numbers rather than causes.
Fictional map/plan example
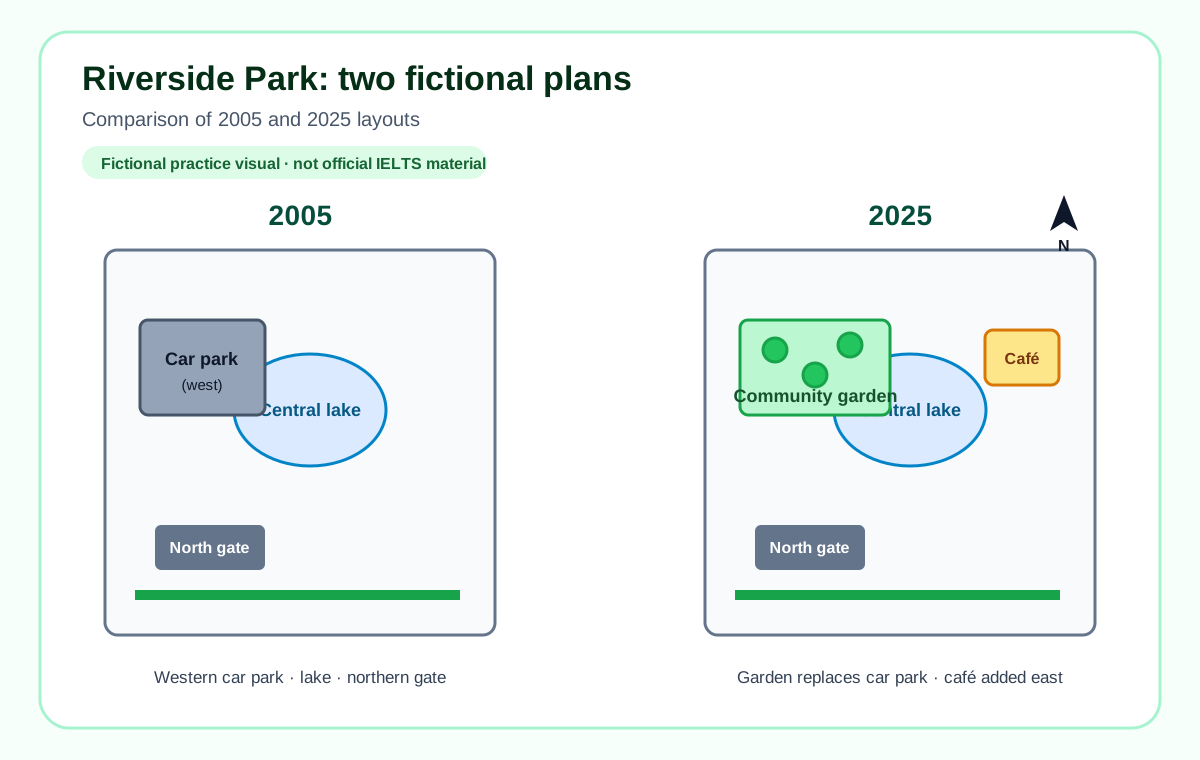
Two plans compare fictional Riverside Park in 2005 and 2025. The western car park becomes a community garden, a café appears near the eastern entrance, while the central lake and northern gate remain. Plan around spatial change: state the redevelopment and meaningful stability, group new visitor facilities together, and use positions only when the supplied plan shows them. Do not claim the park became more popular or environmentally successful.
Fictional process-diagram example
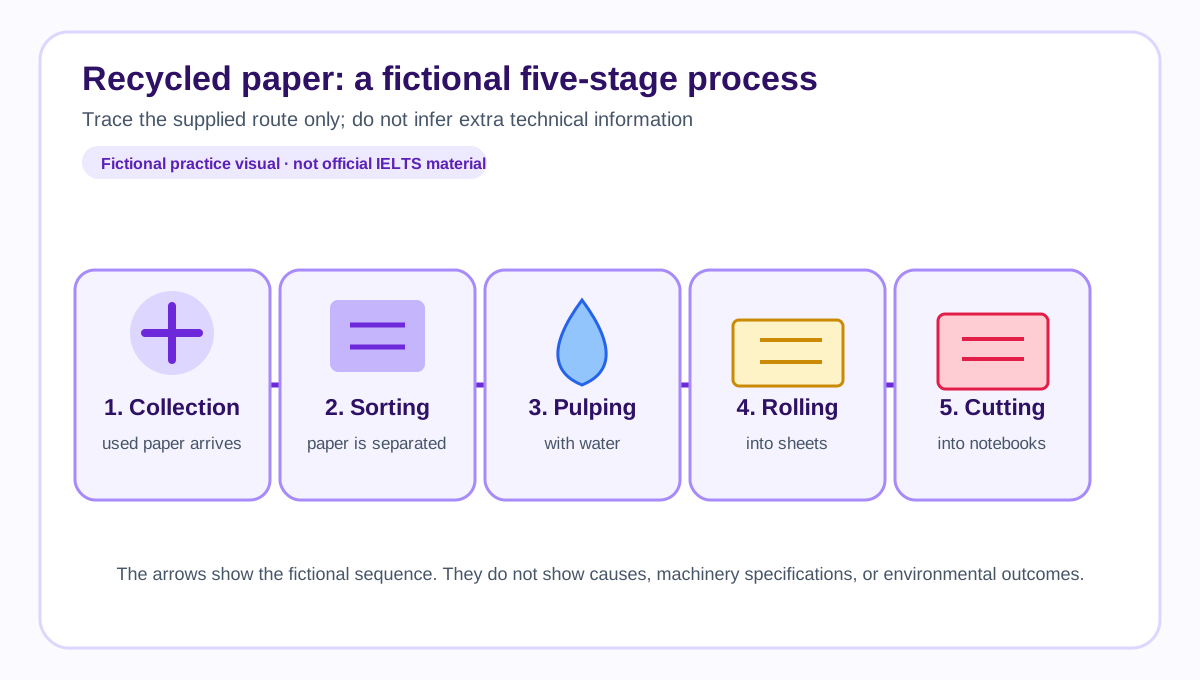
A diagram traces recycled paper through collection, sorting, pulping with water, rolling into sheets, and cutting into notebooks. Plan around sequence: give the start-to-end route and number of main stages, then group preparation and transformation stages in the order shown. Do not add scientific causes, machinery specifications, or environmental benefits that the diagram does not provide.
Fictional mixed or unfamiliar visual example
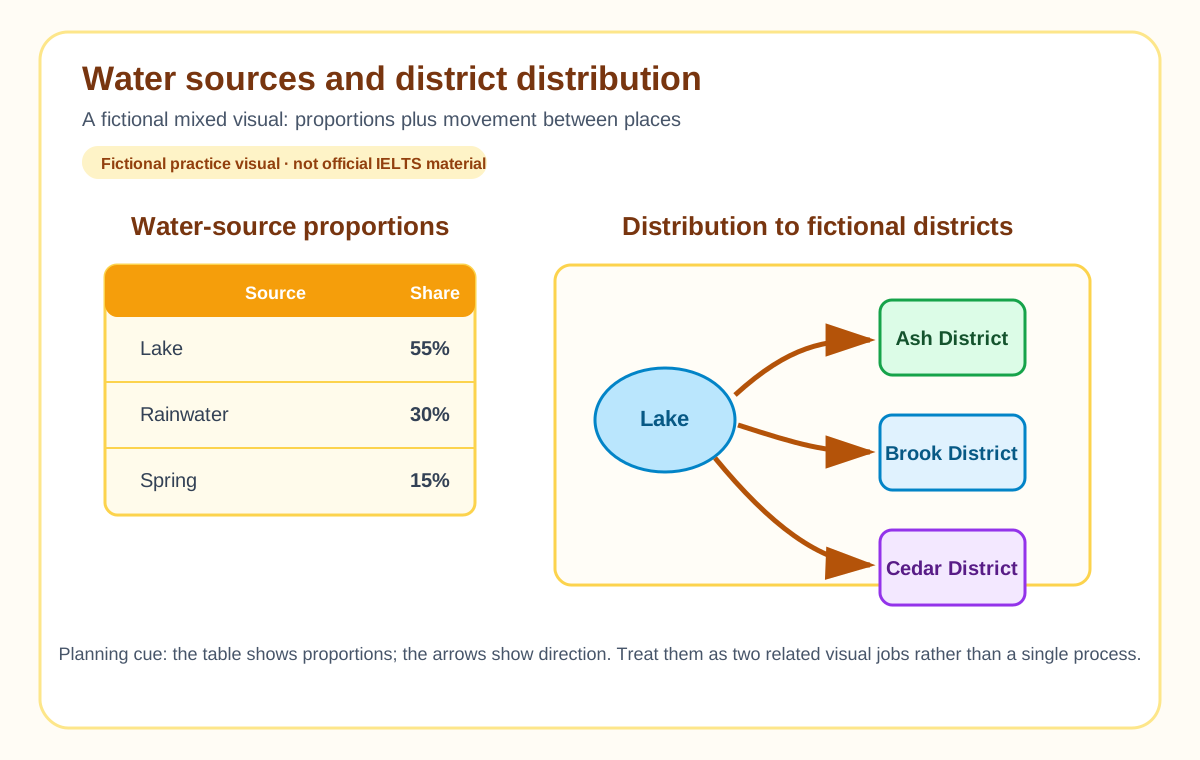
An infographic combines a small table of water-source proportions with arrows showing distribution to three fictional districts. First identify two jobs: proportions in the table and movement between places in the arrows. The overview can name the largest source and the broad distribution route, then select a small set of relevant figures and locations. Do not assume every arrow is a process step or force the visual into a memorised template.
On the real test, write connected text in your own words from the actual prompt and visual. Use the separate IELTS Writing Self-Editing Checklist after drafting to review task fit, paragraph logic, language, timing, and proofreading.
Plan the overview before listing details
An overview names the principal trends, contrasts, changes, or broad process stages. It is not a sentence that merely introduces the visual. Before drafting, make a plain-language note such as: “Overall, [the dominant pattern/change/stages], while [the clearest contrast or secondary feature].” Then check every part of that note against the visual.
- Data visual: identify the dominant trend or contrast, not each category.
- Map or plan: identify major developments and any meaningful stability.
- Process: identify the start-to-finish route and major stages without inventing an explanation.
IELTS guidance advises writers to select main features and make relevant comparisons; its Task 1 preparation material treats a clear overview, sufficient detail, accurate reporting, and appropriate connected format as separate preparation concerns. Preparing learners for Task 1
Fictional planning example: select, then support
This is fictional planning material, not an official IELTS question, real data set, or answer to submit. Imagine a chart showing daily bicycle trips in two fictional towns, Alder and Brook, in 2012, 2017, and 2022. Alder rises from 12 to 44 trips per hundred residents, while Brook remains near 30.
| Planning question | Fictional answer | Why it matters |
|---|---|---|
| What is the clearest pattern? | Alder rises substantially; Brook is broadly stable. | This provides a comparison-led overview. |
| What details support it? | The first and final Alder values plus Brook’s narrow range. | These illustrate the selected contrast without reciting every data point. |
| What must not be invented? | Reasons people cycled more, weather, policy, or motives. | The visual provides numbers, not explanations. |
The lesson is the selection decision, not wording to copy. A real description must reflect the actual task, visual, and a writer’s own connected wording.
Organise the description around the visual
IELTS.org says Task 1 responses should be connected text rather than notes or bullet points. A useful planning order is: introduce the visual in your own words, state an overview, group selected supporting material, then check every comparison, figure, position, or step against the visual. The order can change when the visual needs a chronological, category-based, spatial, or stage-by-stage route.
After drafting, move to the separate IELTS Writing Self-Editing Checklist. That page owns the different post-draft job of reviewing Task 1 and Task 2 task fit, paragraph logic, language, timing, and proofreading.
Use tools narrowly after making the task decisions
The Word Count Calculator can confirm a pasted draft’s word total, not whether it selects the right features or describes the visual accurately. The Grammar Checker can flag possible grammar, punctuation, spelling, and clarity issues in a writer’s own text, not judge Task Achievement or predict a band. The Paraphrasing Tool can suggest alternatives for a writer’s own wording, but any change must remain accurate to the visual and must not disguise copied or prohibited work.
Independent planning, not official assessment
This page is not produced by, endorsed by, or affiliated with IELTS, the British Council, IDP, or Cambridge University Press & Assessment. It does not predict, calculate, or guarantee a band score. Check IELTS.org for current official information. Do not copy answers, invent facts behind a visual, or use a tool to misrepresent work that is not your own.
Frequently asked questions
What is IELTS Academic Writing Task 1?
IELTS.org currently describes Task 1 as a description of visual information in a writer’s own words. Visuals can include graphs, charts, tables, process diagrams, maps, or plans.
What should a Task 1 overview include?
It should summarise the main trends, changes, contrasts, or stages the actual visual shows. It should guide the reader to principal features rather than list every figure.
Do I need to describe every number in a Task 1 chart?
No. Official preparation guidance emphasises selecting main features, making relevant comparisons, and using supporting information accurately.
Can a grammar checker score a Task 1 response?
No. A grammar checker may flag language-level issues, but it cannot select features, judge task achievement, or predict an IELTS band.
Is this an official IELTS Task 1 guide?
No. It is an independent planning guide. Consult IELTS.org for current official format, preparation, and assessment information.
Sources and further reading
About the Author
Zunair Ali Syed is a doctoral researcher in Management Sciences at Minhaj University Lahore and a research consultant with experience in academic research and editing since 2011. He runs QuickEduHelp, with professional interests in digital learning, research methods, and evidence-based academic support.